By David Seigerman, Clean Water Communications Specialist
Dr. Caterina Panzeca was unfazed by the technical aspects of collecting water quality data in Westchester Creek. Her initial concern was the early morning timing.
“Wrangling college students, at that hour, over the summer . . .” Dr. Panzeca said, not needing to finish her thought. “But the students were actually super excited to get up.”’
Of course they were amped and ready to get on the water. If you’re a student at SUNY Maritime in the Bronx, NY, maybe taking classes in the college’s Marine Environmental Science program where Dr. Panzeca is vice chair, what better reason to jump out of bed at dawn could there be than the chance to hop on a boat and cruise from campus on the East River, passing under the Whitestone Bridge as the morning sun slowly rises above Long Island Sound behind you? Especially when you know how the work you’re about to do will be used?
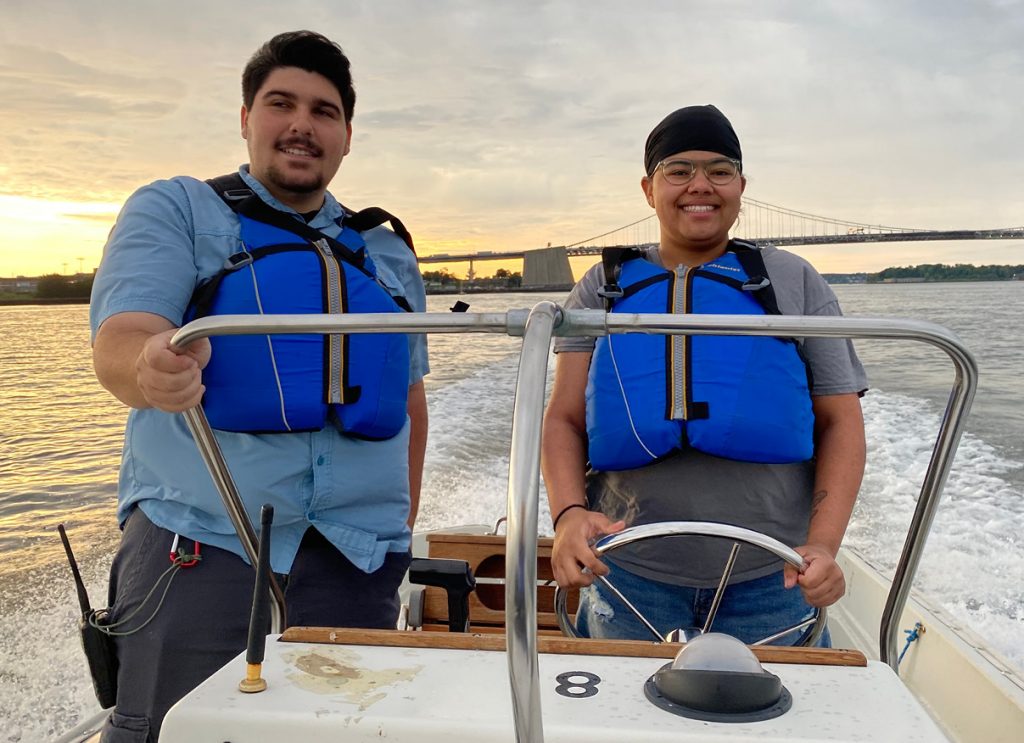
Michael Mongiello (left; a junior) and Angelee Monell (driving; a senior), students in SUNY Maritime College’s Marine Environmental Science program, embark on an early morning water quality data collection trip. © savethesound.org
Dr. Panzeca’s crew joined twenty-five others groups participating in the Unified Water Study, launched by Save the Sound in 2017 to monitor the ecological health of bays and harbors around Long Island Sound. The groups collect two tiers of data: Tier I includes dissolved oxygen, water clarity, temperature, salinity, Chlorophyll a, and qualitative macrophytes. Tier II measures continuous dissolved oxygen, nitrogen, phosphorous, and quantitative macrophytes. All the Tier I data shape the Bay Grades section of the biennial Long Island Sound Report Card; Save the Sound will release the 2022 Report Card this fall.
“Data are sent back to us from all participating groups at the end of the monitoring season,” said Peter Linderoth, Director of Water Quality for Save the Sound, who oversees the UWS – the largest community science program on Long Island Sound, now with forty-four bays and harbors monitored. “There’s a quality assurance review period for all submissions and then everything is entered into complex grading spreadsheets. In short, we take thousands of data points and assign grades.”
The bay grades are different from the open water grades presented in the Report Card. The data for those grades are collected by three agencies that span the Sound, with minor overlap of their territories: the Connecticut Department of Energy and Environmental Protection covers the Eastern, Central, and Western Basins in addition to a section of the Eastern Narrows; the Interstate Environmental Commission monitors some of the Eastern and Western Narrows; and the New York City Department of Environmental Protection is in all of the Western Narrows.
Eventually, all the data points in the open water and bay grades are brought to life as colored pixels, literally painting a picture of the environmental health of the Sound in a user-friendly, interactive map, which is available at soundhealthexplorer.org/fishable. Current and historic grades and data are displayed for the public to see and learn from.
It’s one thing to have high-quality data; it’s another to put it to work. The Report Card is the visual representation of those data points converted into an accessible tool for the eventual end-user, whether they be scientists, community members, environmental groups, or students in Dr. Panzeca’s capstone class for senior Marine Environmental Science majors (where the LIS Report Card has been a reliable resource and effective teaching tool in the research-oriented class).
Elected officials also have found ways to leverage the Report Card to benefit the Sound. Days after the release of the 2020 Report Card, both of Connecticut’s U.S. Senators, Richard Blumenthal and Chris Murphy, delivered a letter to multiple committees of Congress, underscoring their “request for robust funding” with the Report Card’s troubling findings that more than half of the bays received low scores for water quality.
That’s how tools like this are supposed to work. Data are collected, crunched, and converted into grades, which are published to share information that, in part, help identify problem areas. Decision makers can then use those grades to direct funding to projects that address those problems. Information is power, indeed.
Which is the real reason for those college students to get up so early, sometimes in wind-whipped choppy waters and drenching downpours. The Report Card and its data-driven grades can be a wakeup call for anyone interested in protecting and restoring the health of Long Island Sound. To learn more about Save the Sound (and to become a member! – Ed.), please visit savethesound.org. ■