By David Seigerman, clean water communications specialist
Picture standing at Signal Rock, the postcard-worthy spot along Milford’s fourteen miles of Connecticut coastline. You’re looking back at the city’s seaside neighborhood of Woodmont, its famous flagpole and Long Island Sound behind you.
To your left is what the locals call Crescent Beach. As far as official water quality data collection goes, it’s called Anchor Beach 1. To your right is Anchor Beach 2. In terms of physical proximity, the beaches couldn’t be any closer – the rock outcropping where Beach Avenue bends at a 90-degree elbow is the corner that separates them. When it comes to water quality, however, the bordering beaches couldn’t be further apart.
Save the Sound’s 2023 Long Island Sound Beach Report, released in June, provides data-driven water quality grades for 208 Sound beaches in Connecticut and New York. Anchor Beach 2 ranks as one of the 10 best public beaches in Connecticut, determined by averaging grades over a three-year span (2020-2022). During that window, Anchor Beach 2 earned straight A+ grades.
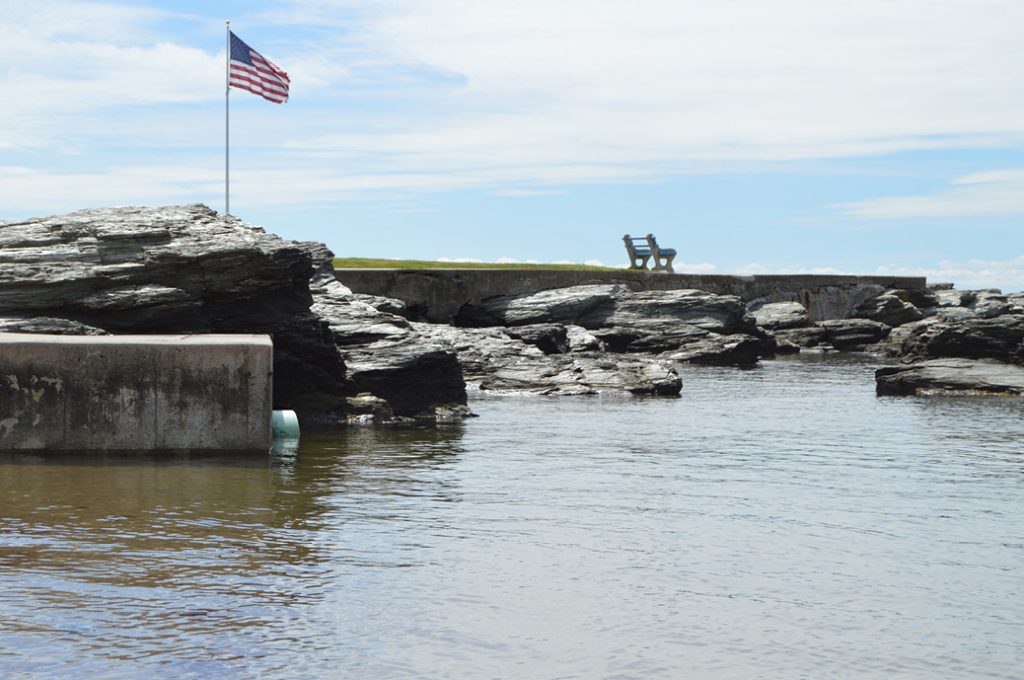
The water quality at every beach on Long Island Sound is determined by factors that are hyperlocal. With its stormwater outfall pipe visible, Anchor Beach 1 in the Woodmont section of Milford, CT is one of the most-challenged public beaches on the Sound, whereas adjacent Anchor Beach 2 (hidden by Signal Rock in this photo) earns consistent A+ grades. © SavetheSound.org
Anchor Beach 1, on the other hand, lands on our list of the most-challenged public beaches around Long Island Sound. Though it received an A+ in 2022, when combined with a D+ (2021) and a D (2020), its three-year average is a C+.
Side-by-side, these two beaches demonstrate one of the critical takeaways from the Beach Report: the conditions at every beach are determined by factors that are hyperlocal. Pollution and poor water quality are common across the region, but the specific causes are unique to each beach.
Take Anchor Beach 1, where a concrete platform juts out from the walkway. Extending from that platform, plainly evident at low tide, is the business end of a PVC pipe roughly two feet in diameter. It’s a stormwater outfall, the output for a network of stormwater pipes draining an entire section of the neighborhood into Long Island Sound. During a heavy rain, millions of gallons of compromised stormwater could be entering the water through that pipe.
Anchor Beach 2 has no such problem. There are a few catch basins on Beach Avenue which drain directly through much smaller outfalls at the base of a concrete retaining wall. But the capacity for any stormwater to pick up pollutants on the short run to the beach is pretty limited. Maybe there’s some pet waste or low quantities of fertilizer from the small front lawns of the houses that look out on the water. Chances are, the rain hits the ground, runs into the catch basin and out to the water before it can collect pollutants.
Situations like this are where the Beach Report can be most helpful. Local health departments and beach managers can see in the grades where water quality at specific beaches may be compromised. That can spur an examination into potential causes – like a stormwater outfall or broken sewer pipe or improperly maintained septic system – and a community conversation into ways to address the problem.
It’s the same across the Sound on Long Island. In 2022, Scotts Beach, Sound Beach POA West, and Sound Beach POA East received grades of A-, B-, and C+, respectively . . . and they essentially share the same water and strip of uninterrupted beach. There’s nothing as apparent as the mouth of an outfall pipe to explain the variation. The differences in these grades aren’t an answer on their own; they’re an alert. Local officials can monitor the grades in our Beach Report, look deeply at conditions on the ground, and try to determine what may be causing the scores at one beach to differ greatly from the ones on either side.
Beaches all around the Sound are subject to similar challenges. They all have to deal with storms exacerbated by climate change. They all are vulnerable to contaminants carried in stormwater runoff, failing wastewater systems, and animal waste. But the way each problem presents at a particular beach is unique to that location.
The grades presented in the Beach Report won’t tell you what the problem is, but they can tell you where to look. Just as the source of pollution is hyperlocal, so can be the solution. ■
Save the Sound’s 2023 Long Island Sound Beach Report – and interactive information for 208 Sound beaches dating back to 2003 – can be found at SoundHealthExplorer.org. Learn more about all Save the Sound’s programs to improve water quality at SaveTheSound.org.