By SAILORS FOR THE SEA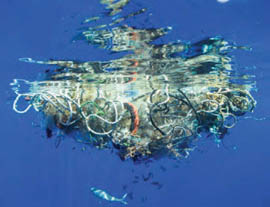
Sailors for the Sea has written a lot of about plastics on our website, and we have more than once highlighted the concept of the ocean gyres, where so-called “islands of trash” float, trapping fish, choking birds, and growing larger with the passage of time. Despite widespread concurrence on the subject, confusion remains, due to the fact that these gyres are not actually floating mats of garbage the size of entire states, an image fostered by some of the earlier, more publicized reports. They are, rather, concentrations of surface and sub-surface floating debris at the convergence of ocean currents. But how much plastic is really there? Conflicting reports and opinions have made it difficult to get a secure handle on the magnitude of the problem.
However, Sea Education Association (SEA) recently published an article in Science reporting on 22 years of data collected in the North Atlantic by their faculty and students on this very issue, giving concrete evidence of the “floating trash heaps.”
Every year SEA sails the Atlantic, Pacific and Caribbean with upwards of 25 college students and 10 professional crew aboard the Corwith Cramer and the Robert C. Seamans. SEA Semester students combine an interdisciplinary academic program of oceanography, history, literature, marine policy and nautical science with a six-week open ocean voyage. From 1986 to 2008, in the Atlantic Ocean, over 4,887 individuals have participated in this study of ocean-bound plastics, collecting and cataloguing over 64,000 pieces of plastic, most only millimeters in size. Through these efforts, SEA has amassed an “unrivaled data set” that helps describe the extent of this pollution, and can teach us about the fate of plastics in the ocean.
So what did SEA find?
Over those 22 years, SEA conducted 6,136 surface plankton net tows on annually repeated cruise tracks throughout the North Atlantic and Caribbean. Sixty-two percent of all plankton tows contained some amount of plastic, with the highest in a single 30-minute tow being 1,069 individual pieces. To scale, that equals approximately 360,000 per square mile. That sounds like a lot of plastic, but many of these pieces are less than a millimeter thick. While it makes for a less thrilling visual, it does make for a more dire outlook for the ocean and its fauna. The data reported by SEA only accounts for floating surface debris. It does not account for plastic that has sunk below the surface or to the sea floor, or been ingested by fish, mammals or birds. Over 22 years, that could be quite a lot of plastic.
Compiling the data, SEA discovered that plastic does indeed accumulate in the North Atlantic Gyre. Not surprisingly, the highest densities of plastic they collected are concentrated between 22 and 38 degrees latitude in an area also known as the Sargasso Sea (or the Bermuda Triangle).
Though this data set displays no significant increase in plastic accumulation between 1986 and 2008, it does show persistent high concentrations of plastic. During this time period globally, there is a very significant increase in the production and discarding of plastic; however data does not account, as we mentioned previously, for sinking, ingested plastics or plastic fragments smaller than 1/3 millimeter, the mesh size of the plankton net. Also, remember that these gyres are not firmly constrained sites, and that currents carry water and debris constantly throughout the interconnected ocean.
The ultimate message here is that plastic, once created, doesn’t go away and a lot of it ends up in the ocean, swirling around for eternity, confusing fish and tainting our food supply.
So what can you do?
• Reduce – Use less plastic! Give up straws, single-use bottles and disposable forks.
• Reuse – Used some plastic? Save it, and use it again!
• Recycle – If your plastic is used up, be sure to recycle it properly. Find out if your town has single-stream or separated recycling, and only recycle those items your local plant can handle.
• Read more – Read the full SEA article in Science.
• Check out the more recent data collected in the Atlantic.
• Learn more about SEA and how you can support their work sea.edu.
• Enroll in a semester at sea and help SEA continue their data collection.
Editor’s note: This article originally appeared on Sailors for the Sea’s blog and is reprinted with permission. To learn more about Sailors for the Sea, visit sailorsforthesea.org.